
G-007 · General
One firm. Eight weeks. 186 hours back.
A civil engineering firm ran SheetAgent for Civil 3D on live project work: five seats, real deadlines, real clients. After the trial it converted, from five seats to fifteen.
186 hrs
estimated billable time recovered, about $18,600 at a $100/hr rate
498
layouts built
273
layouts updated
1,941
layout audits
1,952
command runs · 71 sessions
“We produced 105 sheets in 4 days, counting several iterations and edits while learning how to use the tool.”Project engineer at the firm, during the trial
The firm and the work
A civil engineering firm, unnamed at its own request, ran a five-seat trial on its live project work for eight weeks: real deadlines and real clients, not a test drawing. When the trial ended it bought fifteen seats.
Every figure on this page comes from the firm's own Manager Portal report, the same per-command reporting every customer gets.
What the trial measured
The sheet-production work SheetAgent for Civil 3D does, counted command by command: 498 layouts built, 273 updated after the design changed, and 1,941 layout audits, across 1,952 command runs in 71 sessions.
The hours are estimated from those runs: each command has a published minutes-per-run figure, multiplied by how often the firm's seats ran it. Layer management, support viewports, key maps and exhibit work are left out, so the real figure is higher.
What changed in the workflow
Sheets were built from tiles in model space rather than drawn one viewport at a time, and kept current with Update Sheets rather than rebuilt when the design moved. The 273 updates alongside 498 builds are that revision work: absorbed by the set instead of by the drafter. See how sheets stay current after design changes.
The project engineer's own account of the first days is the quote above: 105 sheets in four days, while still learning the tool.
✦Estimated hours = command runs × published minutes-per-run, summed across value-bearing commands over an eight-week period. Excludes layer management, support viewports, key maps, and exhibit workflows. The real figure is higher. The separately quoted figure of about 95 billable hours recovered per seat per year is the conservative cross-customer floor; these case-study numbers reflect one firm’s measured eight-week period.
Workflow examples
Illustrations from Setline's own demo drawings. The firm's drawings are not shown.
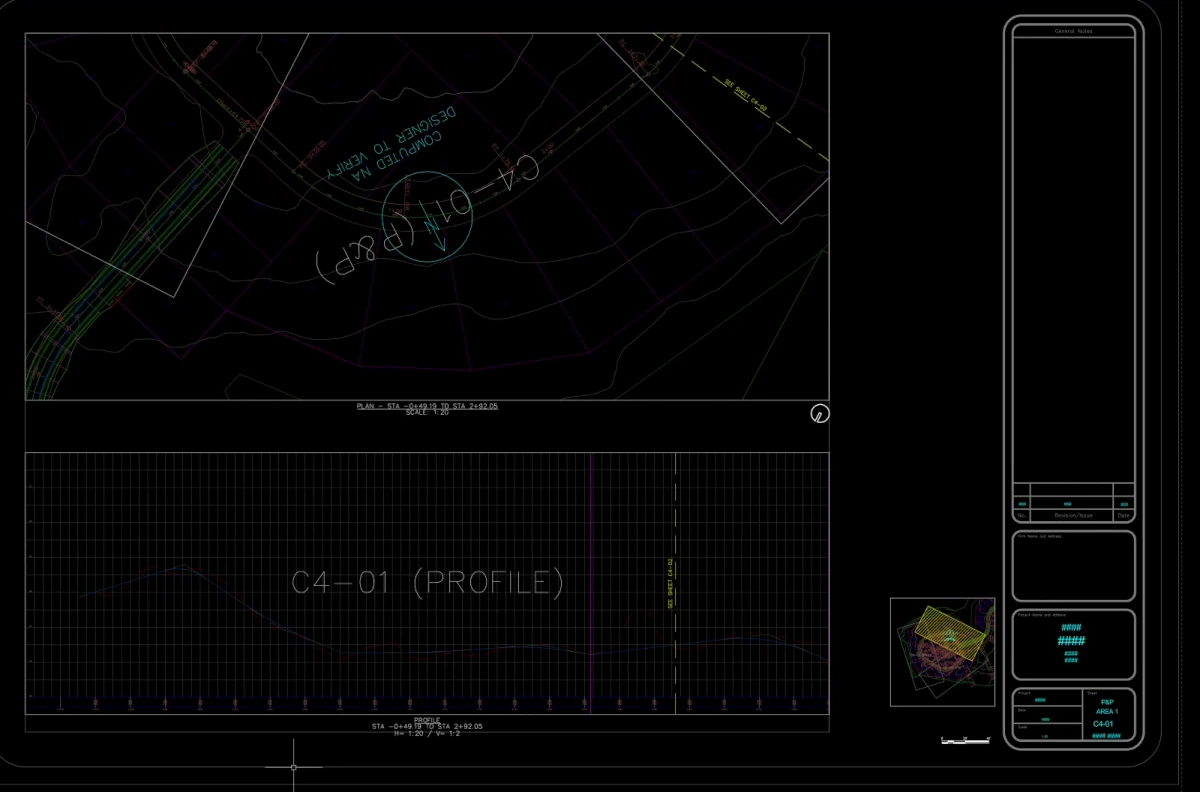
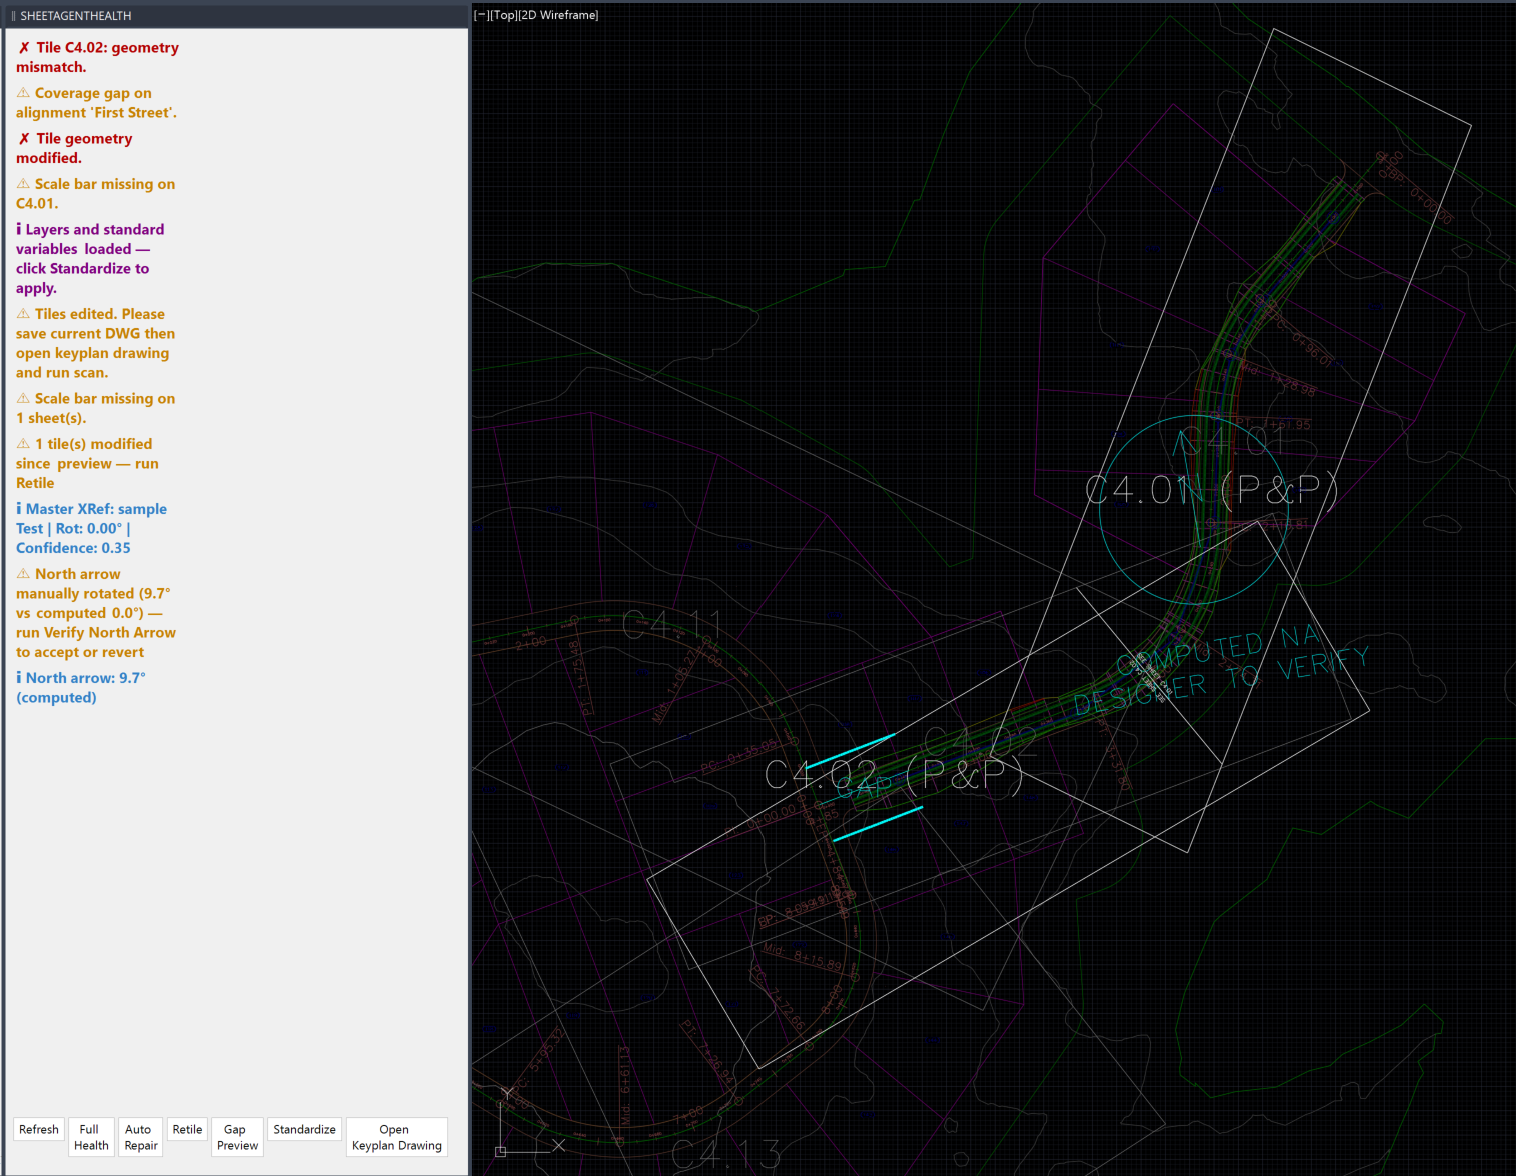
The capabilities behind the numbers
- Civil 3D sheet set automation: building the set from tiles.
- Keeping sheets current after design changes: the 273 updates.
- Health and existing drawings: the 1,941 audits.
- The Manager Portal: where these numbers come from, for every customer.
Want the same numbers for your own team? Start a 30-day trial; the Manager Portal reports them as your seats work.